
The Fed didn’t push up interest rates as was widely expected by futures traders and scaled back on the talk of the multiple hikes communicated in the last quarter of 2015. I have long held the view that the selloff in January to the middle of February was all about the cost of money. The market voted strongly that they didn’t believe the US economy could handle the increases and the FED has taken note.
In January and February when the markets were tumbling an average of 9.1 billion shares were changing hands per day. In the rally of the past month the average volume has been lower at 8.1 billion shares per day. In particular the run up to the Feds decision was on very low volume. The four day window before the announcement was on a volume of 6.9 million which was well below the average for the month and year.
From a technical perspective markets falling on high volume and rising on lower volume is a weak sign.
The SP500 closed on Friday at a 0.786 retracement of the last daily range. 0.786 is the square root of the Golden mean 0.618 and a very important level in markets. Candlestick analysts will also note that the SP500 also charted a “hanging man” at the FIB level and that’s also a worry. A good friend once pointed out that a candlestick reversal pattern has predicted 100 of the last 10 reversals.
Earnings of the SP500 companies fell by 3.3% in the last quarter of 2015 and they are expected the fall in the first quarter of 2016 as well. The Market Climate section of VectorVest adds a 50 day average of SP500 earnings which is massaged between 0 and 2, akin to all other metrics on VectorVest. Below 1 on the Market Climate scale indicates a bear market and that’s where we are situated presently.
The trends of both the US and UK markets speak a much more positive story. In both countries they show that both the short term trend and underlying trend are rising. In both markets the price, momentum (RT) and breadth of the VectorVest Composite are rising day over day and week over week and that’s shown by three Green Lights on the Color Guard on the front page of VectorVest. On both markets there is a star within the Green Light on the price column on the Color Guard and that shows that the price is rising and also being confirmed by rising momentum. In VectorVest speak the Green Light has been confirmed by the RT Kicker timing signal.
Take David’s 5 week Vectorvest course – click here
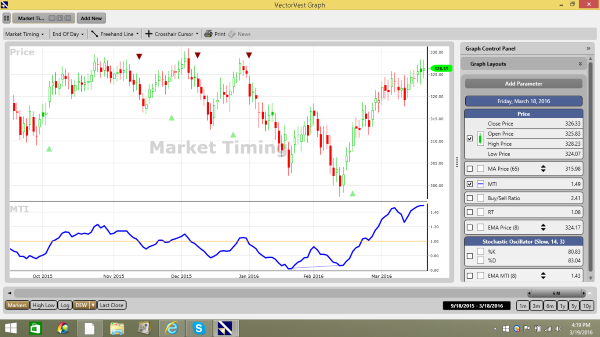
The Market Timing Indicator on VectorVest has some amazing leading indicator properties. The indicator is a combination of the momentum of both the price and the breadth of the VectorVest Composite. In mid-February the MTI predicted the turn up when it recorded a value of less than o.6 on a scale between 0 and 2. Presently the MTI is sitting over 1.5 in both countries and that’s becoming overbought in the same way as 0.6 was oversold. The MTI is saying that even under the most positive circumstances that the market needs to stop for a breather soon.
The UK Composite is shown below.
In the UK I have added to my holdings by purchasing Gleeson and Marshalls as indicated at the last webcast. All the shares in my portfolio are in the money and on BUY recommendations. Long may that be the case.
I have spent the last few days at the VectorVest “Trading like a Pro” course in Charlotte North Carolina. The course was excellent and has added immensely to my knowledge of how to use VectorVest to find high probability trades each and every morning. I will try and communicate some of this experience in the User Groups and webcasts.
I am sitting in my positions and following the signals.
David Paul
March 19th 2016
Try Vectorvest for 5 weeks – click here
Be the first to comment on "The FED Blinks"