
Stock markets all over the world suffered sharp losses during the past week as the market focused on the prospect of a summer hike in interest rates from the FED. The last time they thought of doing this the market reacted with such authority that the raise was postponed. That was the cause of the selloff in January to the 11th February.
In the UK the VectorVest Composite the short term trend or Primary wave kicked up during the week but my key DEW market timing system didn’t turn upwards. The latter is an exceptionally robust method of knowing when to attack and knowing when to play a defensive game. Defense was the game plan last week although many of my shares had a good week. In the volatility of 2016 the DEW system has been a rock of stability giving timely signals just after the highs and lows of the year.
After the close on Friday the Primary Wave is down, the DEW is Down while the underlying trend remains upward. For those timing the market with the Confirmed Call system this remains positive but only by a hairsbreadth. The latter is the longest term signal on VectorVest and it’s close to a turn with the MTI (Market Timing Indicator) on a figure of 1.01. Below 1 the underlying trend is defined as Down.
My shares in a poor market did well during the week. My word you sleep well when you know that your net worth is mostly tied up in undervalued shares that are growing earnings both safely and aggressively. I am particularly happy with Persimmons and Gleeson. Both shares (and all builders) fell and tested their lows of the last year. In shares with great fundamentals these lows are outstanding levels to be a buyer. That’s the basis of the “Lost Motion” trading system that I was taught from the works of Gann and Wyckoff. I intend to write more about this trading methodology in the next edition of this blog. It’s made me a lot of cash over the years.
Persimmons and Gleeson have still got a lot of work to do but they are going the correct way. I see Bellway (not in my portfolio at present) has broken a down sloping trendline and also looks good for further advances. The share shows an excellent example of a Lost Motion trade as it fell through the last major low and then reversed. The reversal was confirmed by a text book “outside day” candle or bar chart pattern. The entry was the open of the next day after the outside day at an entry point of 24.14. The share is now over 26 and heading for the old high at 29. The good trade is always the hard trade.
If you feel that you are always getting in at the top of a move and always chickening out near the lows the “Lost Motion” setup will sort that out for you. The setup takes courage and if there were no ladies reading I would call courage something else. A point to note is that these trades should get into the black quickly. If the setup fails (and they do, I assure you) then the market can collapse. The “Lost Motion” setup should only be used in liquid counters and by traders who won’t hesitate on applying stops.
Marshalls issued a trading statement which disappointed and the share came back towards the support trendline defined by a symmetrical triangle. This support and a 62% retracement of the last range have a confluence at around 300. At around this level the share will also have charted a positive Gartley 222 pattern which adds to my enthusiasm for the share at these levels. If the DEW turns up and I see some confirmation candles I shall be tempted to buy a few more.
Dart is hanging around 625 buy my stomach tells me it will get to 600 before moving up again. It will take some very positive news to get the City to buy it above support which is at 600. I hope I am incorrect in this.
Keller is going well for me. I bought it based on reasonable fundamentals and a Wyckoff “spring pattern” on the weekly chart. This is a special form of a “Lost Motion trade and it’s worked exceptionally well in this case. Victoria is at support at 1400 and I am watching the stop here carefully. I am in defensive mode as stated above.
Join David at Round-the-Clock-Trader for his live webinar on market timing – click here
During the week I completed a webcast on trading with VectorVest and in this I was asked by a long term user of the program to suggest a series of steps to locate a high probability low risk trade and that’s what I will try and complete here. It’s my own way of doing this and may vary from that taught by other VectorVest presenters. It’s vital that a trading plan suits your beliefs about markets and consistent trading in markets. I am not saying that the below steps are perfect but they have worked for me over the years. Over the last 6 years when I have been using VectorVest in addition to my technically based rules, the success rate has risen. The setup is a breakout. The strongest shares don’t pullback to old lows. In these plums is where the easiest money is made.
- I wish to trade long in only the very best stocks that are undervalued, growing earnings strongly and safely. In my own trading I frequently look at shares with relative safety (RS) below 1. If I was managing money for others I would not. As the RS falls the probability of a surprise rises and the public don’t take well to that. Think of Plus 500 for example.
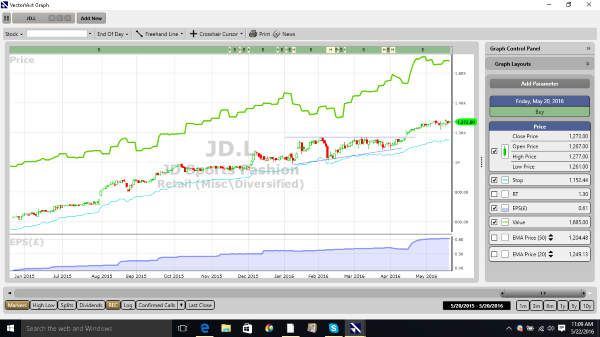
- I “cherry-pick” these stocks by using the VectorVest simple layout which is within the dropdown “Graph Layouts” on the top right hand side of each chart. This layout shows Value and price in a single window and Earnings per Share (EPS) in another. As is taught in lesson 4 of the “Successful Investing Quick Start Course” I look for the price to below the value and the EPS to moving from the bottom left of the chart to the upper right. The course is built into the VectorVest program under the “training” tab. Remember EPS growth is the engine that’s drives the share price. If the company is growing then it can spend on acquisitions and research and development on both new markets and products. I have found that the smoother the EPS chart the easier goes the trading. The price should be trending upwards with little volatility. Have a look at the JD Sports chart. The share is a great example of the above and has been an outstanding performer. The chart of JD Sports is shown below
- To find shares that are trending strongly with little volatility use the Comfort Index (CI). The CI is the unsung hero of VectorVest in my opinion. It combines trend, volatility and improving fundamentals into a single number between 0 and 2, akin to all other metrics on VectorVest. Above 1.4 in my view finds a share that is trending with little volatility.
- Unisearch is the tool within the VectorVest program that allows the trader to find shares with various combinations of all the VectorVest metrics. A search which includes Price less than value, Earnings potential (RV), Relative Safety (RS) and CI, finds some great shares that are undervalued and growing earnings strongly and safety. This can be done in seconds. If you are in any doubt about writing a search then just pick up the phone and support will talk you through the process. The call is free on 0800 014 8974 in the UK and 0800 981 891 in South Africa.
- Market Timing is 70% of the exercise. There are market timing systems on VectorVest for short term swing traders and longer term position traders. I use a medium term system which is between these extremes. It’s simple in derivation but very powerful. The DEW system gets me into a new bull market quickly after the turn and into a defensive mode or into cash or bonds just after the top. The Green Light and the advice on the front page of VectorVest is the least that should be in place before getting into the market. The DEW will be slightly later than Green Lights on the home page but the turn will be better confirmed.
- I have spent the last 25 plus years looking at charts and in particular chart patterns. There are two basic types of chart patterns. Firstly a reversal pattern which occurs at the very start of a trend such as a head and shoulders reversal or a double top or bottom. Secondly there are continuation patterns which is where an established trend stops for breath. These are literally money in the bank and the basis of this simple strategy. These patterns are invariably a triangular or a rectangular price pattern. Over the years they have developed a host of names. First prize for me is a triangular consolidation in a share that’s trending strongly with a high CI. I clearly like to see that it’s trading below the VectorVest valuation and that the EPS is moving upwards. I have noted the following. If, within the consolidation, the EPS is rising, the probability of a strong breakout is high. Again JD Sports is the perfect example of this. In the case of the recent move, the triangular consolidation was an ascending triangle. This is a triangular pattern in which the lower bottoms are rising. Within the duration of the pattern the EPS was rising and when the breakout came we had a highly probable move.
- I think that there is a little work required for some to become familiar with these simple patterns. It will be time well spent as when they are second nature you will have a skill where no computer or algorithm can compete. There are lots of references to these patterns on the net but I suggest a book “Getting Started in Chart Patterns” by Thomas N Bulkowski. In the book Thomas will show you how to compute targets for these patterns. I will do the same in the next series of UK Q and A webcasts. The book was the second I gave to my son when he became interested in trading. The first was “Reminisces of a Stock Operator”.
- The entry point is a close above the resistance line offered by the pattern. I use the VectorVest calculated stop and from this size the position so as I only risk 1% of my account on any single trade. To get the math’s of this calculation please study lesson 2 of the “Successful Investing Quick Start Course”. The lesson will also give you some excellent tips on managing the trade and especially not giving back any more than 50% of any profits.
- The technique above combines excellent fundamentals with a high probability technical breakout when the general market is rising. That’s the VectorVest edge in markets. The best of both worlds.
In my next post I will look at a much more aggressive trade which gets me involved well before any breakout. This is the “Lost Motion” setup that I have introduced above. I use exactly the same shares with the same excellent fundamentals. In this case as we will see the CI is not quite as important and that the technique is more suited to the volatility of the moment.
David Paul
May 20th 2016
Join David at Round-the-Clock-Trader for his live webinar on market timing – click here
Be the first to comment on "The Cost of Money Once More"