The VectorVest Composite of the UK market has stalled with the breadth of the market as measured by the BUY/SELL ratio falling under 1. The Primary wave or short term trend is down whilst the underlying trend is UP.
The UK Composite has risen over the past month in a rising wedge formation and fell during last week from exactly the trend line defining the highs of that pattern. A rising wedge is a bearish pattern and with the market action last week a further pullback is probable. Thus the advice on the home page of VectorVest “does not advocate buying shares at this time”. I have a proprietary method of calculating the target from a rising wedge pattern that I have developed over the years. This technique is reliable and shows a downside target for the rising wedge at 317 pence. This does not mean that the market cannot fall further. It means that if and when the UK Composite falls to 317 then the wedge is played out in terms of gauging the future.
The Dow 30 cash ended the week pretty much where it started on Monday morning with the 17650 level that I have been highlighting still prominent. The level is a 78.6% retracement of the annual range. The rally from the August low is a perfect example of a bearish Gartley pattern and I have no doubt that all FIB orientated players and funds are short. Don’t stress, they are flesh and blood like ourselves and they frequently get it wrong. The difference between these guys and average trader is that they lose little when they are wrong and make lots when they are correct. If the 78.6% hold and the market falls then they have a lot of profit potential on the down side. Risk to reward is what it’s about and many big winning traders insist on a theoretical 5 to 1 payoff before taking a trade.
To add to the short side scenario, Friday’s market action charted an “outside day” bar pattern which is bearish, especially at an important resistance level. The candle pattern charted during Wednesday, Thursday and Friday collectively, is known as an “evening star” and it’s also bearish. I have heard it said that bearish candle patterns have predicted 100 of the last 10 reversals and there is a quite a bit of truth to that. The FIB level and the Gartley pattern plus the candle patterns add weight to the pullback scenario.
A similar situation is found on the broader SP500 with patterns and FIB levels identical to the Dow cash. I talk mainly about the Dow because it’s my preferred spread betting vehicle and I know its turns and personality intimately.
I had meant to add to my portfolio last week but a hectic schedule of travel, meetings, events and my worry about the 78.6% retracement on the Dow resulted in nothing being done. I am still 70% invested and my strategy is to stay in these shares as long as the underlying trend remains UP.
Try VectorVest for 5 weeks – click here
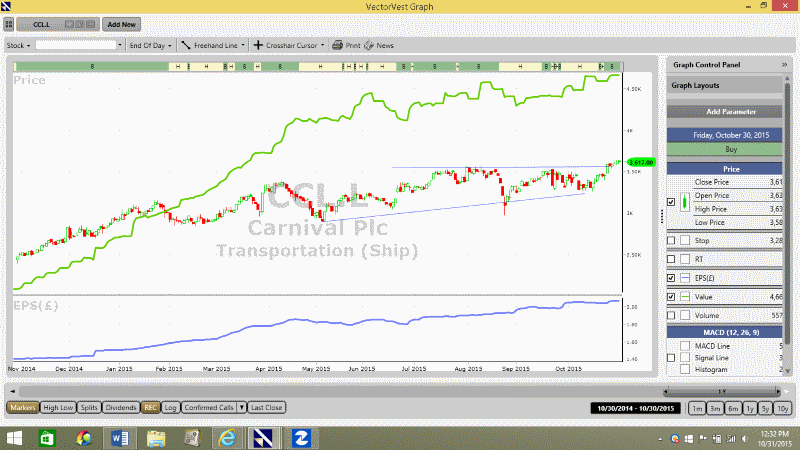
I have spoken about these shares at length and am very excited about the market action in BPI and Carnival. With a decent market these shares seem bound much higher. BPI has a high of 750 to get through and from there I hope blue sky. CCL has broken from an ascending triangle that’s been six months in the making and looks bound to the VectorVest valuation of well over 40 pounds.

CCL is a great example of what I require in a share. The chart is shown above.
- The share is undervalued and showing an excellent combination of earnings potential (RV) and earnings safety (RS).
- The share price is rising with little volatility. The longer term trend is measured on VectorVest by the Comfort Index and CCL has an excellent score of 1.5. Over 1.3 shows a share that is trending strongly with little volatility. The Comfort Index finds trending shares in seconds.
- Earnings per share (EPS) is rising smoothly from the bottom left of the chart to the top right. EPS is the engine that drives the share price.
If the above are present the future, although slippery, can be predicted with a certainty that’s unusual in this line of work.
I think over the next few days that a pullback is likely and leveraged traders especially should be very careful. Everyone should be watching stops closely although the high VST shares, that I specialize in, are exceptionally resilient in a downturn. We saw that in August and again last October.
Once this pullback is out of the way then the next leg up should start and the so called “Santa Rally” begin. That’s what my Elliott says but please just stick to the advice on the front page of VectorVest. That’s reality.
Take my 5 weeks course plus 5 weeks access to the VectorVest – click here
Good Trading
David Paul

Be the first to comment on "Stock Markets find technical resistance"