
All roads lead to Jackson Hole, Wyoming, for direction on USA Monetary Policy. The gathering will take place next week. The communication by the FED during the last few weeks has given myself and other FED watchers a very sore head and confused disposition. My experience over 25 years of watching the FED, is that mixed messages mean no change.
Last week the stock markets of the world sold off after FED New York president Dudley told Fox news that he felt the market had underpriced the odds of a September rate hike. I believe it would take a hawkish message from Yellen at Jackson Hole plus a big jobs number at the start of the month to precipitate a September rate increase.
The cost of money as we saw after Dudley’s talk last week and from the Feds miscommunication folly at the end of 2015, is the biggest stock market headwind in town.
In the UK, RBS reports that it will soon charge corporate clients to keep their cash. The QE experiment charges on with the BOE buying over 1 billion pounds worth of long term Government IOU,s or debt. In the same week the treasury sold over 1 billion pounds worth of long dates Government debt. A nice little earner for those wise fellows in the middle. I am just a Mechanical Engineer at heart and certainly no economist, but this makes little sense.
The short term trend on VectorVest UK has turned down after the close on Thursday `18th August and remains down at the close of Friday 19th August. The underlying trend remains UP. That’s been the case since the end of February 2016. The advice on the front page of VectorVest suggests caution and that’s excellent advice in a market that seems much overbought. Overbought and oversold are dangerous words and to paraphrase Jesse Livermore “I have never seen a share to high not to go higher and too low not to go lower”. All measures of sentiment such as the VectorVest proprietary Indicator MTI (discussed in detail here last week) and the CBOE VIX are screaming “be careful out there”.
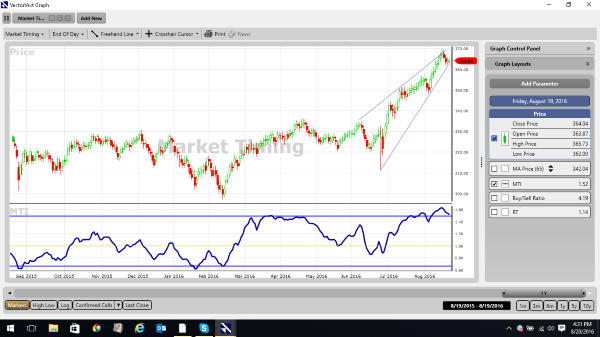
The VectorVest Composite is shown below. Please note the overbought level of the MTI in the window below the price. Also note the bearish rising wedge that’s in its final stages. Please be very careful with open profits.
During the week I have sold my position in Gleeson. The share has recovered its Brexit losses but still is within a downtrend as defined by my 20/40 week moving average technique. The Weekly Zone Trade (WZT) technique indicates that the share is a candidate for a short sale. The WZT is a model of market action that I have spoken about in this forum over the last few weeks and at the VectorVest User Groups in both countries. It is a robust trend following model of price action that requires scrutiny and possible action only once a week. The only indicators employed are a 20 week and a 40 week simple moving average. If the 20 is above the 40 then we are in BUY mode. If the 20 is below the 40 then sell mode. The best place to BUY is when the price pulls back into the zone between 20 and 40 averages. The entry then needs to be confirmed with a reversal candle.
Fevertree and Hill and Smith have had another good week with the latter breaking above its first FIB target. The first FIB target is 1.618 times the last pullback added to the low of the pullback. VectorVest calculates the target for you and in my Monday afternoon webcast I will show everyone how to go about this exercise. All VectorVest customers should get an invite and guests are welcome to call for an afternoon guest pass. Our call centre is on 0800 014 8974 in the UK and 0800 981 891 in South Africa.
The first FIB target on Hill and Smith was 11.50 and the second target (a 2.618 expansion of the pullback added to the low of the pullback) is 14. That’s close to the VectorVest calculated value of the share. The technical and fundamental view are for once coincident. I bought Hill and Smith at 8.90 and it’s been a great ride that’s seems far from over. The entry was a pullback into the 20/40 zone that was confirmed by a “hammer” weekly candle pattern. It was a text book example of the WZT that you should study to fully understand a very simple but powerful chart setup.
I held Fevertree through Brexit with an entry at around 7. The share is fully in sync with the 20/40 WZT and is trading at 10 pounds at Fridays close. Fevertree is trading well above the VectorVest valuation of the share so I urge caution here. I will bank this fairly soon as 40% profits in a few weeks can be defined as “windfall profits”. My first mentor in SA taught me to take windfall profits without hesitation.
JD Sports gave our hearts a free checkup during the week. The share has now recovered all of the fall and the weekly candle has charted a very positive “hammer” candle. Old cynics would probably agree that nervousness around the CPI number caused shares to move from weak hands to strong hands. Last week’s trading has the look of classic smart money accumulation. I think after this is complete the 13 pound ceiling to date will crumble. The first FIB target as computed by a 1.618 extension of the last pullback is at 15 pounds while the VectorVest valuation is at 20 pounds. The second FIB target is at 18 pounds and with a fair wind from the overall market that’s highly probable. Unfortunately there will be many a scare like this week market action between now and this target being attained.
JD Sports, Fevertree and Hill and Smith are examples of what occurs when the fundamental position of a company is in sync with the technical position (trend) of both the share and the general market. When all three measures are positive then extraordinary gains are possible. This is my personal method of using the VectorVest program and it’s a style of investing that I named “Value Momentum Investing” a few years back. I have resolved to use the weekly 20/40 system to define the technical position of the share.
Cranswick has retreated from the last high at 24 pounds. The last high was the third attempt to break 24 and my mentor MR Gann always believed that markets would break on the 4th attempt. I am happy to sit in this exceptionally well-managed company. The relative safety (RS) on VectorVest is 1.47. On a scale between o and 2 this is well above excellent. The probability of Cranswick dropping the ball is low.
Trifast has moved upwards a tad and closed the week at 1.40. The VectorVest valuation is 2.00 and the technical target from the flat topped triangle on the weekly chart is about the same. The company has a lot of its earnings from Europe and thus should benefit from the weakness in the pound.
Both Keller and RSA Insurance have done little since I purchased them although both are trading slightly above water. If the market should continue to fall over the next few days they will be the first to be sold.
I am watching the market action on Dart carefully. The share has good fundamentals as defined by VectorVest and recently has charted a potential double bottom. The 20/40 weekly system is still intact but the reversal weekly candle is still missing in action. Until this occurs and the share turns upwards I shall continue to watch and be patient.
It’s been a great few weeks. My job now is to make sure that I don’t much of these profits back to the market while still obeying rule 1 which is “Let winners run”.
David Paul
19th August 2016
Start David Paul’s 5 week course including 5 week trial of VectorVest – click here
Be the first to comment on "Next Stop Jackson Hole"