The US Non-Farm jobs report surprised all on the upside with 271000 new jobs created. The unemployment rate fell below 5% which is a 7 year low. This clearly added to the probability of a rate hike in December and that caused the dollar to add to the gains it has made this week and strengthen across the board.
As I write on Friday afternoon, after the London Close, the stock market has not moved and appears to be digesting the information. In the US financials are up as they tend to make more money in a higher rate environment, while utilities are down as their margins get knocked as rates rise. For many months a good number from the economy was perversely bad for the stock market and we haven’t seen that this afternoon. I suspect that the market feels that the number is so good that a ¼ point hike won’t matter to any great extent.
Try VectorVest for 5 weeks – click here
As all readers will know my favorite trading pattern is the Gartley pattern and use the pattern often to pinpoint low risk, high probability trades. The pattern is simply a thrust upwards followed by a 3 wave pullback. I spotted a bullish Gartley on the Ft100 cash 1 hour chart today. At the NFP news I traded the Ft100 “long” with an order at 6344 which was 78% of the last hourly range. The market fell to my order at the news and although the volatility was scary it jumped 40 points very quickly. I took ½ off and got my stop to entry and unfortunately got stopped on the second half. I have been watching and trading unemployment Friday for 25 years and I get every bit as excited now as I did away back then.
I have been short the Euro$ for many days and have reported the trade in the bi weekly webcasts that I do on Monday afternoons. That trade was taken from a bearish Gartley pattern.
As the Dollar gets stronger the immediate casualty is commodities and they have taken a major hit with formerly blue chip shares like Anglo on life support. I have always used the Copper price to guide my decisions in all commodities and the metal is known by many as Dr Copper. If you have a look at a weekly chart of Copper the downward sloping channel is easy to see with the metal pushing down towards the low of the channel. In the last few weeks Copper has been bought twice at a 1.27 extension of the last weekly range and created a double bottom at that level. This looked promising but over the last few days the 1.27 extension is under attack once more. If this level is breached then in my view Copper and many other commodities have further to fall. In the days ahead a fall towards the low of the channel and a 1.618 extension of the last range looks probable. The Copper weekly chart is shown below.
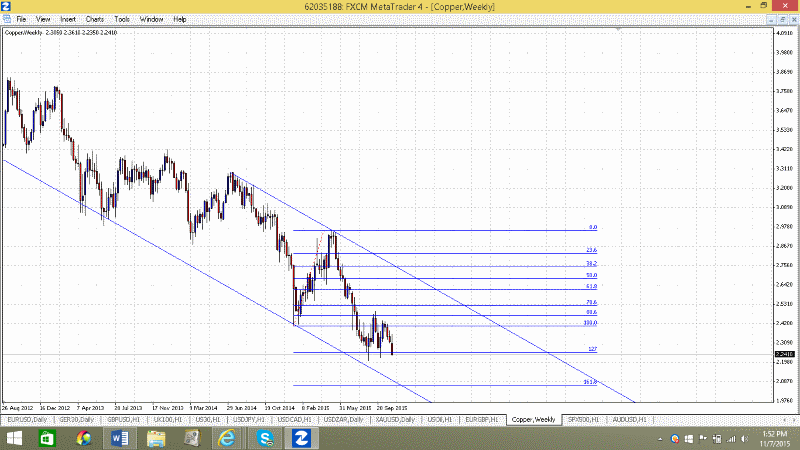
I think it’s early to consider buying commodity shares and it looks to me as if both Copper and Iron Ore have further to fall. As a technical analyst I believe (and thus its true for me) that the bigger the bear the bigger the subsequent bull. This is the largest bear market in commodities in recorded history and I have no doubt that when it turns, the profits that will be made, will be life changing. For me that means moving from Camden to Kensington. I am waiting patiently and diligently watching the copper price very carefully. An exhaustion towards the low of the weekly channel may define the low of this bear market.
Try VectorVest for 5 weeks – click here
I have been using VectorVest in South Africa for 6 years and actively in the UK for 4 years. In all that time there has not been a sighting of a commodity share in the top 50 as ranked by VST and none have been seen in my prudent to conservative searches. As the index and Ft100 bench mark is commodity heavy, the high VST shares have thrashed the market and the trackers during 2015. The latter are flat for the year whilst the conservative searches such as “Pale Blue Chips” are up more that 20% in 2015. Even for the most modest portfolio or pension pot, VectorVest would have paid for itself many times over during 2015 compared to mindlessly following the index.
The VectorVest Composite is UP and UP with a green light in the price column of the Color Guard. This means that the short term trend is UP and the underlying trend is UP. The green light shows that the Composite is UP day over day and week over week. I am holding all my shares and I see Howden had a great day on Thursday. Avon is still the leader and Barratt the laggard for now. As long as the UK market keeps rising I have no worries about any of them. I have been worried about a pullback in the trend of the Composite and that’s kept me from adding three move shares, to become fully invested. I will let the market decide on the NFP on Monday and Tuesday before committing more cash.
Those of you who follow my work will have seen the Lost Motion setup working to perfection in several high VST stocks recently. Howden, Savilles and now I hope Barratt went back and fell below a significant low and reversed before going higher. The Lost Motion (as named by WD Gann) setup and the Gartley have stood me well over the years and both engineer low risk high reward trades. When the setups are married to high VST shares the results are excellent
I will be running a webcast on Monday afternoon at 130 UK time and will discuss the rules of the Lost Motion setup in detail with recent examples from the shares named above. If any would like to listen and haven’t got a login please phone our call centre on 0800 014 8974 in the UK and 0800 981 891 in South Africa.
Try VectorVest for 5 weeks – click here
David Paul
November 6th 2015.
Be the first to comment on "Massive Jobs number"