In my early years of building a consistently winning trading plan, a mentor, unfortunately long since dead, used to shout across the office “where are the orders”? Those that attend the VectorVest seminars will have heard the story of my induction into stock trading when sharing an office with a chartist in the early 1980,s
During the course of the week past the smartest money had their orders at very predictable places. Smart money likes to buy and sell at extremes. They know that their ability to predict what’s going to happen next is not much better than anyone else but at an extreme they can test their trading idea with little risk. This means they like to buy the market at lows with a tight stop and if the trade works they have a big move ahead. This increases risk to reward. Ensuring that you make lots when you are right and lose little when you are wrong, is what the business of trading is all about.
Hedge fund manager and billionaire trader Paul Tudor Jones takes it further. He requires 5 times more potential upside when he is right, compared to what he will lose when wrong, before taking a position. Traders call risk to reward, R multiples and the concept is covered in detail by Van K Tharp in his book “Trade your way to Financial Freedom”. It’s a book that all traders need to become familiar.
During last week the Ft100 and the VectorVest Composite fell hard at the start of the week. If you remember I felt that this was probable based on the technical picture last weekend. I also talked about my views on the stock market in a theoretic discussion with Zak Mir from Tip TV. This discussion is recorded on this blog and on the VectorVest Facebook page. Please remember my predictions are my best shot at the future and in the words of Mark Twain “The future is a very slippery commodity”
On Tuesday the low of the day on the Composite was defined by a 62% retracement of the range from the “Black Monday” low to the high of the 9th September. The smart and brave money who are Bullish simply bought the level and there was enough around for the level to hold. On Wednesday we saw a bounce and then on Thursday a retest of the level which held. On Friday the bulls had a great day and as we will discuss below so did out high VST stocks.
On Friday afternoon the Composite and the FT100 after a great day upwards found resistance at 62% of the range between the high on the 9th September and the low forged on Tuesday and Thursday this week. That’s where the smartest and bravest bears were sitting in wait. They don’t short lows but short into strength at FIB levels. In afterhours trading the futures market fell into the close from the FIB level.
In summary we have a battle on our hands in the UK market in a tight range where opposite views have each picked levels to test their trading idea to maximize the R multiple if the outcome is favorable. If the trade doesn’t work and they get stopped, then the loss is small and they will make it up and more in the next high R multiple trade. As well as explaining what went on during the week I am hoping that this post will help all understand how large and professional trading funds think. I know that this is far from how most of us manage our own portfolios.
The trends on VectorVest are Down and Down which means both the short term trend and the longer term trend are bearish. The Ft100 in particular rose to the FIB level on Thursday and Friday while charting a text book Gartley pattern. This pattern can only be seen on an hourly intraday chart. It is a bearish pattern and within the downtrend will attract many short positions. The level is around 6120 on the Ft100 cash market. I have discussed the Gartley in a post on the VectorVest UK Facebook page which is where I post short messages (if I have the time) during the course of the week. These also go out on Twitter. After I posted the Gartley on social media on Friday the Ft100 fell 70 points. In terms of technical trades, Gartley patterns in the direction of the underlying trend are high probability events. I took profits as I don’t hold leveraged index trades over the weekend.
For a 5 week VectorVest trial and 5 week course with David Paul Click here
For my investment portfolio the best thing to do at the moment is to follow the advice on the front page of VectorVest. Prudent Investors should stand aside and watch stops carefully. The Color will alert us to when it’s safe to initiate new positions and it’s far too early as yet.
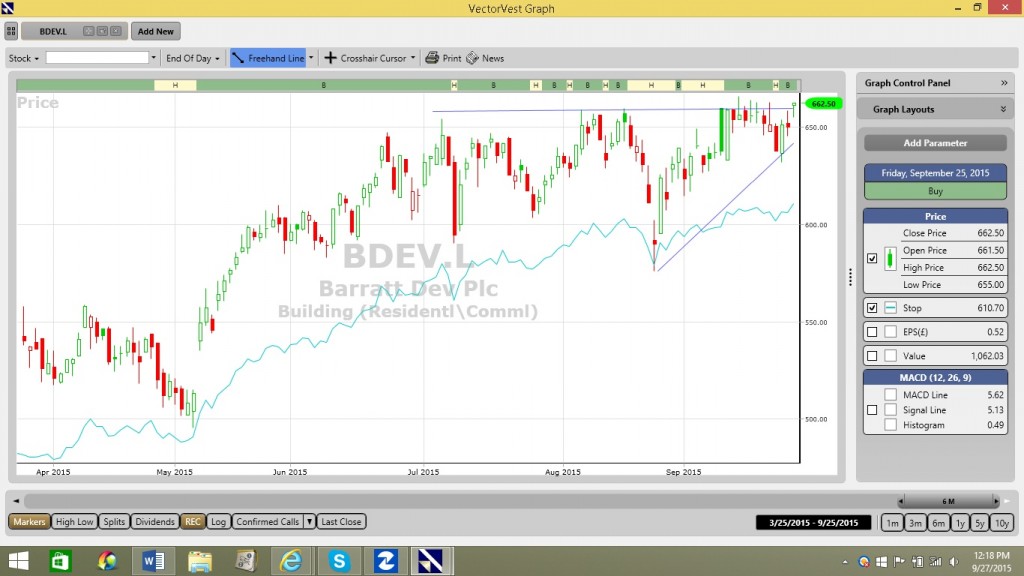
The really positive aspect of this selloff is how the high VST stocks have held their own and prospered. JD Sports is breaking new highs and the builders such as Barratt look like following. Carnival looks positive for a break after the Black Monday move down has cleared out the weak hands. Avon has pulled back and kissed former resistance and looks to be on the move again. The Big Hitters stocks certainly make you sleep well each night and the market action in this downturn tells me that they will blast off when the general market turns. The Barratt chart is shown below.
I am hoping that the Black Monday low in the stock market will hold and the FIB low which held on Thursday helps that view. A close above the high of Friday would certainly help as would a daily close above 6120 on the Ft100 cash.
As I detailed with Zak in the video, a break of the Black Monday low (which is a 38% retrace of the range from the Euro Crisis in 2011 to the high of this year) could result in a down move to 50% of that range. This level charts a confluence with the 2007 high and would result is quite a haircut for the stock markets of the world.
Once again the trends are down and we need to proceed with caution until this market confirms a bottom.
David Paul
September 26th 2015
For a 5 week VectorVest trial and 5 week course with David Paul Click here
Be the first to comment on "Bullish and Bearish views slog it out"