
The S&P 500 (ETF Proxy – AMEX:SPY) has behaved exactly as forecast in my last column. Price has bounced over and over within the grey “Struggle Zone” and offered many profit opportunities for intraday traders as we wait for a sustainable daily bottom to form.
I am waiting for the chance to put on some short exposure for what we are forecasting will be a major new leg to the downside. As price rallies in this bounce to areas of resistance I’ll hope to be able to update this chart with a new red zone in the next week or two.
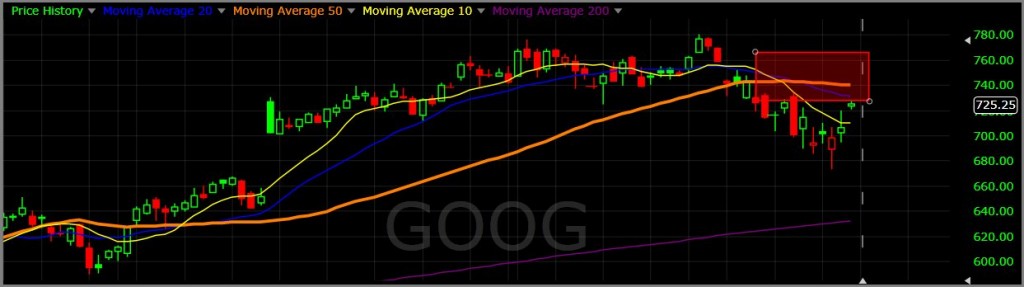
“Alphabet” (NASDAQ:GOOG) has rallied dramatically in the last year, and now is showing signs of a major top. You can see our forecast for an area of short exposure on the chart here in red. This top could precede a major decline in the stock’s price, so I have no profit objective at this time.
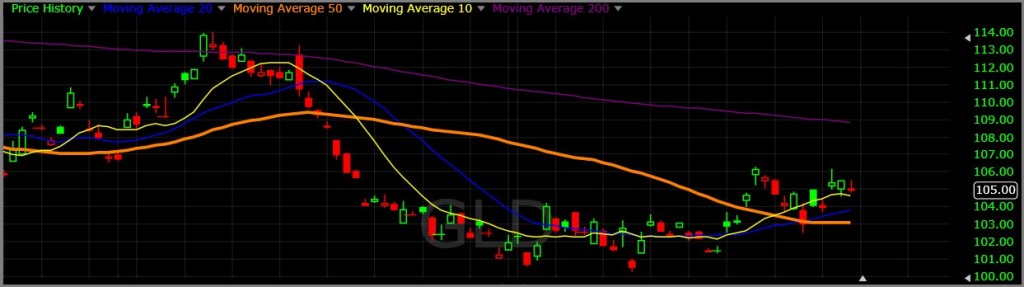
The weekly chart of gold, as expressed below by the GOLD ETF (NYSE:GLD) has made a significant bottom on its weekly chart. Having confirmed its recent daily lows by forming a higher low/higher high pairing in its daily chart, we are forecasting that this market will likely chop sideways for the next week or two as it gathers strength for a new leg to the upside.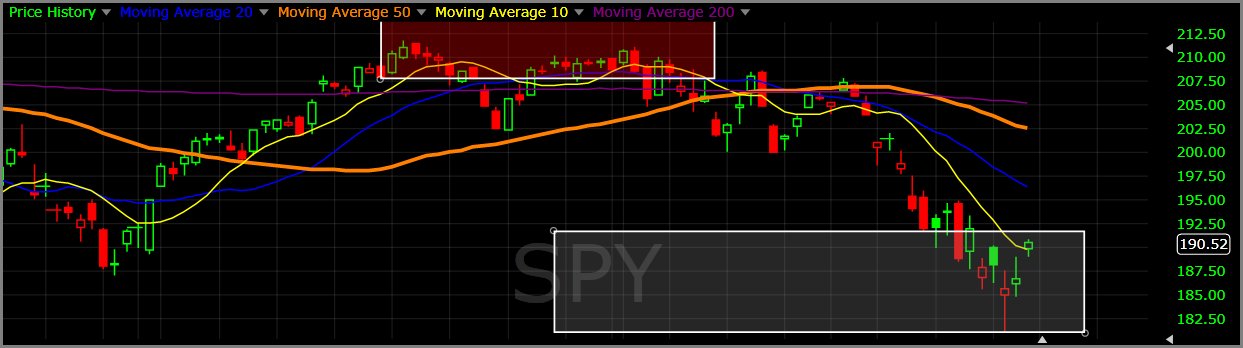
Be the first to comment on "Bo Yoder S&P Analysis"