
Stocks rose as investors wagered that today’s U.S. jobs data indicated a steadily improving labor market, while not advancing the case for an imminent increase in interest rates.
The US Bureau of Labor Statistics reported that the U.S. economy hired 151,000 nonfarm workers in August, disappointing analyst expectations of 180,000 jobs. The private sector added 126,000 jobs. The national unemployment rate is a steady 4.9%.
Click here to start your 5 week of VectorVest
A deeper analysis of the report showed the majority of jobs added in August fell below the measured median wage. A sizable 30% of new jobs fell into the lowest-paying areas of the economy. Restaurants and bars led the way, adding over 30,000 workers. In my view the jobs report was poor, not only because of the lower than expected new hires, but also because of the lack of quality new positions created.
Fed Vice Chairman Stanley Fischer said this week that economic reports would determine the direction of U.S. interest rates. Last week Fischer highlighted today’s jobs release as being significant. Following worse than expected manufacturing data on Thursday 1st September, interest rate derivative traders reduced bets on a September hike.
Futures prices in the interest rate derivatives market indicating only a 34 percent chance of a rise in September which is down from 42 percent at the end of last week. The odds for a December increase in interest rates are about 58 percent.
The cost of money staying low until the US elections are out of the way is driving the Ft100 and US markets upwards as I write after the London close on Friday 2nd September.
The ft100 has been pulling back with the confines of the equidistant channel since the middle of August. The channel is easy to see on a four hour chart of the ft100 cash. In this time the Primary Wave on VectorVest has been down and I have been taking intraday trades on the index using the 30 minute chart. I only take intraday trades in the direction of the Primary wave and that’s caused my hit rate in these trades to increase enormously.
On Wednesday 31st August I noted that there was a confluence between the lower trendline defining the channel pullback on the Ft100 and a 62% retracement of the last upswing. The pullback had all of the characteristics of a “bull flag” which classic technical analysts believe is a very bullish pattern.
I felt that this level of 6740 which was just 30 tics below the last high was where the smartest bullish money would have placed their orders. In all markets and in all timeframes I actively look and hunt down these confluences of support in bullish market and confluences of resistance in bearish markets. I reported on social media that 6740 was the level to initiate a low risk trade on the Ft100 index. Please follow us on the VectorVest Facebook page if you wish to get access to my thoughts. I only post when there is something important setting up.
This analysis proved to be correct and after the close on Friday 2nd the Ft100 is at about 6900.
Confluences of support can be determined from a chart in many ways but three stand out. These are old resistance becoming support (horizontal lines on the chart), trend line support and FIB levels. When they come together then low risk trades can routinely be engineered. When I say “low risk” I am not speaking about “hit rate”, I am addressing the fact that it only takes a few points to prove whether the trade will be successful or not. On the Ft100 trade I used a 40 point stop and already the profit is 150 points which is a risk to reward of greater than 3.5.
The really positive aspect of buying at support is that most of the City analysts will be doing the same. I know this because I have spent many years working with professional traders and buying at support, rather than “chasing” the market, is what they do. Because of this, most trades taken at confluences of support move far enough to get your stop to entry, even if they eventually fail to be profitable. This has a big effect on p/l and it has a very positive effect on your mental state. However, buying at support is difficult emotionally and I suppose that’s why it’s profitable. It’s the things that are difficult emotionally that make the money. It’s the things that the crowd cannot do that will make you rich.
Click here to start your 5 week of VectorVest
Let’s try and complete a few bullet points on a simple trading plan using VectorVest.
Firstly I only wish to be trading “long” in the very best shares. For me this means that the company is undervalued and growing earnings both aggressively and safely. VectorVest puts a value to all of these metrics and it’s a simple process using Unisearch to find shares that are fundamentally sound, that suit you. Value, Relative Value and Relative Safety summarizes the fundamental position of the company easily with zero heavy lifting by the trader/investor for all 2200 companies on the LSE and AIM.
Secondly I want the share to be in the throes of a trend upwards. There are many ways of measuring the trend on VectorVest. In the past few months in this blog and at the User Groups I have been using the weekly chart to determine the trend. Added to the weekly chart are a 20 week and a 40 week simple moving average. If the 20 is above the 40 the trend is up and the 20 is below the 40 the trend is down. If you load a weekly chart of JD Sports for example, the trend is clear by using this, the simplest of tools. I have noted that shares frequently pause for breathe by pulling back into the zone between the 20 week and the 40 week average. Again this pullback is clear to see on JD Sports and on many shares with excellent fundamentals around the Brexit vote. This pullback into the zone creates a great buying opportunity and that what I did with JD Sports and Hill and Smith to name a few. These trades have been catalogued in this blog and on my Tip TV appearances with Zak Mir.
Thirdly, the entry point. Here we have a choice. To date I have been teaching that the trader wait until the reversal in price within the zone is confirmed by a reversal weekly candle pattern. There are only a few patterns that occur repeatedly. These are “hammers”, outside bars, morning stars and inside bars. A little research on the net will easily define these terms for those not versed in candle patterns. Again the weekly reversal candles are prominent on the charts of JD Sports and Hill and Smith.
I think waiting for a candle pattern to confirm is fine and it’s what I did as the market reversed after the vote. However I could have looked for a high probability support level by using trend lines, old highs becoming support and FIB levels as described on the h4 Ft100 trade above. This is what the professionals were doing just after the Brexit vote and it was their buying at support levels that created the reversal candle patterns. On Hill and Smith on the 27th June the share price collapsed to a confluence of an old high made just before Christmas last year and a 62% retracement of the last weekly range. That was the level and that’s where the professionals had their orders and the buying power over a few days created the hammer candle.
In your trading plan the entry can then either be with a weekly confirmation candle OR by using the more subjective and leading but simple support and resistance techniques. When I am at my best I will always try and get onboard with the latter. I am always not at my best. The stop loss using support and resistance techniques is much lower and thus I can load up on the number of shares purchased and still only risk 1% of my portfolio on any single trade. If you are in doubt of how to make this calculation then please study lesson 2 of the Quick Start Course on VectorVest.
Click here to start your 5 week of VectorVest
Buying at support can be very difficult emotionally. The market is tanking and you are getting ready to be a buyer. Sometimes they just keep on falling and you get stopped a few minutes after entry. Stops are essential with the technique. The losses are small especially if you start with a tiny position and add to the position as it becomes profitable.
The issues that the crowd struggle with are well known and written about in every trading text. Yet traders and investors fail to act on these time after time. The books say cut losers quickly and let winners run. The crowd does exactly the opposite and continually add to their misery by averaging their losers. In all my years of teaching traders I have not as yet found a trader that didn’t have some internal resistance to putting a plan (even a simple few lines) down on paper.
I have frequently completed a 3 day course at the institutional level covering in detail what I have discussed in what started out as three bullet points above.
If you haven’t already done so then please complete the 5 week Quick Start Course on VectorVest. It’s located under the “training” tab on the home page of VectorVest 7.This will simply talk you through the process of putting together a simple plan “that suits you” to take advantage of the enormous edge in markets that VectorVest offers.
All my positions are intact and all apart from Keller on a BUY recommendation on VectorVest. The Primary wave on VectorVest has turned UP after trading on Friday 2nd September, while the underlying trend has been UP since the last week of February.
I would be surprised if the VectorVest composite UK didn’t make a new high from here. If I observed the Composite making a new high while the MTI charted a falling high that would be a worry. That’s a divergence between price and momentum of price and it usually precedes a turn. In February the mirror image of this occurred and marked a major low and a change in trend. In February the Composite fell into the middle of the month while the MTI charted a rising bottom.
If I observe this divergence between the price of the VectorVest Composite and the MTI in the present overbought area, I will be taking some or all of my money off the table. The VectorVest Composite for the UK is shown below.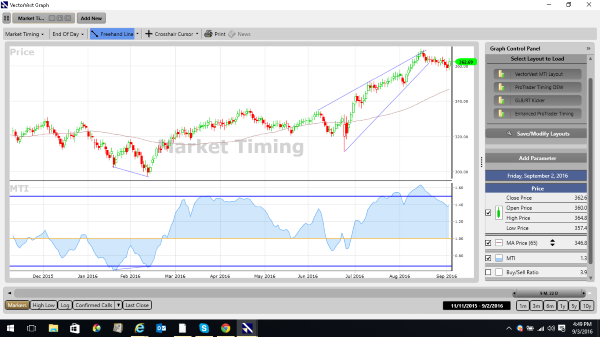
For now I will sit and watch stops carefully.
I will revisit the trading outline above and illustrate how to define support within an uptrend at the next Q and A webcast on the 12th September and at User Groups in both UK and SA.
David Paul
2nd September 2016
Be the first to comment on "Average Jobs number takes a September hike off the table"