
[Watch the recording of David Paul’s webinar from 31st May – Short Term Swing Strategies]
The US no farm payroll report is eagerly awaited each month to measure the health of the world’s largest economy. It was poor and well below expectations and the worst number in many years.
Initially the stock markets of the world fell but by midsession in the US the reality that this would reduce the probability of a June interest rate hike to nearly zero caused a rally. By the end of the day the Dow Jones was back to where it started. The currency and bond markets voted strongly that rates would not rise in June with the dollar tanking across the board even against emerging market currencies that are less than investment grade.
Janet Yellen is speaking on Monday and the jobs number will essentially mean that her talk lacks the ability to surprise the market. I think that rates will now be on hold until after the USA elections towards the end of the year. Clearly the next hurdle for the stock market is the EU referendum on June 23rd. Nervousness around this event has already pushed the cost of insurance (known as forward cover) against a move in sterling to the levels of the crisis of 2008.
Gold was the big winner of the day jumping 30$ as the currency weakened. Also a 5% jump in the amount of negative yielding Government debt to 10.5 trillion dollars may have helped the rise in price. Gold may not pay a yield but at least it doesn’t cost to park your cash in the yellow metal.
I had an order in Gold at the 78% retracement of the last daily range at 1204$. The market stopped at the 62% retracement and I missed the fill.
Saudi Arabia has appointed its first new oil minister in 20 years. In a recent Vienna meeting of OPEC an output ceiling was proposed but no number agreed. Veteran oil analysts believe that the days of uncapped production are numbered. The oil price stayed above 50$ in Fridays trading. The correlation between stock markets and the oil price remains intact.
[Start your 5 week course with David Paul including 5 week trial of VectorVest US & UK – click here]
The Dow found strong support at 17690 which is where trendline resistance from the sideways flag formation of the last few weeks has become support. I traded the Ft100 intraday on Friday twice using a 15 minute intraday view. I was long on both occasions simply using my “Lost Motion” entry signals on that timeframe. It’s exactly the same trade as I described last week which was on a daily chart of a UK building stock. The setup is all about a market falling below an old low and reversing. The reversal should be confirmed by a bar chart pattern or just simply by a close above the lowest bar. The concept is simple and robust and preceded some strong moves. I didn’t trade around the news although there was a valid chart setup.
The VectorVest Composite of the UK is positive for the bulls on all time frames. Both the Primary Wave and underlying trend are UP and the underlying trend has been confirmed by price action. The UK Composite has been signaling a Confirmed Call UP since the middle of February 2016. On the Color Guard Friday close resulted in three green lights. This means that the price, momentum and market breadth was UP both day over day and week over week.
During the week the DEW technique gave a new BUY signal after the close on Wednesday past. I decided to wait on the jobs report before adding to my positions, which I forgot about when writing here, last weekend. On Monday I will consider buying some Marshalls. It would be great to enter Marshalls at around 300. At the 300 level which is 62% of the last move the share will have charted a bullish Gartley 222 pattern.
Dart is charting a triangular formation and is sitting near the support of the triangle after a 3% fall on Friday. I know many exited the share before the pullback and 600 to 620 would make a good level to get back on board.
I am happy with my two construction shares although they will be volatile in the run up to the vote on June 23rd. Both Persimmons and Gleeson are excellent businesses and remain excellent investments.
It’s time to have a relook at Avon Rubber. Technically the share is finding resistance at the technical level and has charted a “double inside bar” pattern at that level on a weekly chart. Please keep an eye on Avon as a break and close above 920 should precede a strong move. At present the share is deciding.
[Start your 5 week course with David Paul including 5 week trial of VectorVest US & UK – click here]
Similarly Keller is consolidating at a technical level defined by an old trendline. The share has been grinding around the 950 level for two weeks. A break above 980/1000 should precede a strong move. I will add to the share if and when this takes place and the DEW remains a positive.
Although considerably overvalued in the short term, Fevertree has a relative value (RV) of 1.5. This means, over a three year window into the future, that Fevertree should outperform an AAA rated corporate bond by 50%. This is an excellent number. VectorVest reckons the share will grow earnings next year by 38% with EPS doubling over the last year. Technically the share recently gapped out of a consolidation pattern and looks bound much higher. There is much more risk in purchasing a share that’s trading above the VectorVest valuation and thus should only be considered by those comfortable with managing risk proactively.
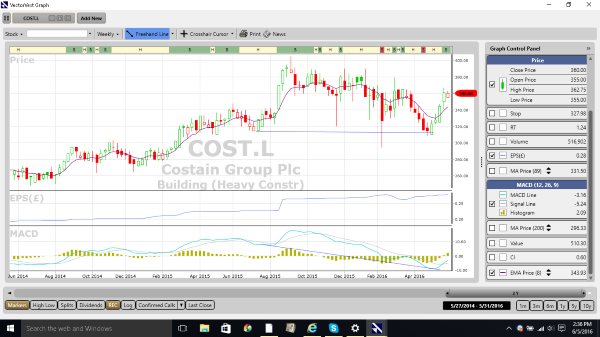
I like both the technical picture and the fundamentals of Costain. The share is undervalued and has a RV of 1.4. Relative Safety (RS) at 1.22 is good. I always start my technical analysis on the weekly chart. Here I notice that the share has charted a very positive reverse divergence pattern with the weekly Macd. Some refer to this as hidden divergence and others call the pattern a “slingshot”. Recently the reverse divergence has been confirmed by the share trading above an 8 week exponential moving average. A famous trader from the US calls the 8 period average the “trigger line” or the T line. Last week Costain charted an inside bar where all of the price action was contained within the range of the previous week. As in the case of Avon and Keller, a break upwards from this pattern, above 370 should precede a strong move in the share.
The chart of Costain is shown below.
Markets climb a “wall of worry” and barring a surprise from Janet Yellen on Monday the next hurdle is June 23rd.
David Paul
June 4th 2016
[Start your 5 week course with David Paul including 5 week trial of VectorVest US & UK – click here]
Be the first to comment on "An Ugly jobs report"