
[Register now for David Paul’s Smart Trader Workshop Tuesday, 31st May 7.30 BST – Click here]
As discussed in the last entry I would like to detail a simple and robust method of trading shares with great fundamentals that has an excellent expectancy. Expectancy just means that the technique makes a lot more money when its right compared to what it loses when it’s wrong. Remember the objective of the exercise is to build wealth and NOT to solve a puzzle.
The technique is mentioned in both the works of my mentors Gann and Wyckoff and I salute their efforts. In my early days in trading I was definitely trying to solve a puzzle. The works of Gann and Wyckoff are far from easy going and I have spent decades trying to decode what they were saying. This setup is a small but very profitable part of their work. Let’s begin.
I will be talking about long trades here but the setup works equally well in shorting markets.
- I only wish to trade “long” i.e. buy shares, cfd,s, or spread bet in shares with outstanding fundamentals. The technique buys at support. If the fundamentals are good then that’s what the professionals will be doing and that simply means that the probabilities of support holding is much higher. This means the share should be trading below the VectorVest valuation and that the Relative Value (RV) and Relative Safety (RS) should be well above 1. I normally like to see a RV of greater than 1.3 and a RS of greater than 1.2. If you have a look at Bellway in the UK market these metrics are met.
- Recently Bellway pulled back and fell below a major low. I like to see the market fall and make at least a 21 day low. Bellway fell through the major low on the 15th April and stopped out many who would have placed their stops below the last major low. The share closed below the last major low for a full 6 days.
- MR Gann would have been a buyer as the share reversed upwards through the old low. This can be noisy and I suggest that you wait for a close above the level. In Bellway the first close above the last major low occurred on the 25th
- The bar/candle that closed above the old low was an “outside bar” which is a potent reversal pattern. At these reversal points a knowledge of bar patterns and candlestick reversal patterns will be useful and push up the probabilities of success.
- After the outside day reversal at the old low the next thing to do is to buy the next open on the 26th This was at a level of 23.42 with a stop below the low at 22.29. This was a risk per share of 1.13 calculated by subtracting the stop level from the entry level.
- The next and most important exercise is now to calculate the number of shares to be purchased so as no more than 1% of the account will be risked if the setup fails. This is covered in detail in lesson 2 of the Successful Investing Quick Start course which is parceled within the VectorVest product.
- The first target is the next old high which is at 26.75. If you are a fan of the late Mark Douglas then that’s where half of the position should be banked and certainly the stop brought to entry. This initial risk/reward ratio is around 3. For swing trading this is more than acceptable and no one including myself would be critical if all the position was exited at this level.
- In shares with great fundamentals the pullback is invariably a liquidity drive by professionals which takes place prior to a large move. That’s why it’s critical to apply the setup to the very best shares fundamentally and Bellway certainly fits the bill.
- The next target is the 52 week high at around 29. There is no definitive rule on where you should exit. Short term swing traders should have got out at the first high mentioned in 6 above. Many traders are position traders but use the Lost Motion technique to enter the market at an excellent level. These traders will be letting the position run and managing the trade via a trading stop loss or just using the VectorVest stop loss.
- If the 52 week high is broken then the next targets are defined by FIB extensions. Take the 52 week high and subtract the low of the 20th This is the magnitude of the pullback. Multiply this number by 1.27 and add it to the low of the 20th April for the first target. Then multiply the magnitude of the pullback by 1.618 and similarly add to the low of the 20th April for the second target. Shares with great fundamentals after a liquidity drive frequently break upwards an onwards to these levels and much higher. JD Sports is a great example of that.
[Register now for David Paul’s Smart Trader Workshop Tuesday, 31st May 7.30 BST – Click here]
I could write for days about the nuances of the Lost Motion setup. It fulfills my three basic beliefs about successful trading and investing. The chart of Bellway and the trade is shown below.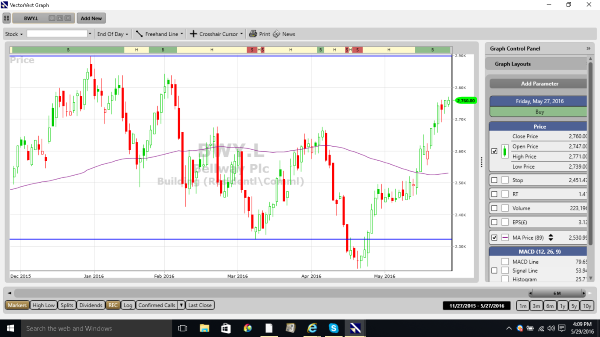
- The good trade is the hard trade. This doesn’t mean it’s intellectually difficult. There is no rocket science above. I mean that the trade should be emotionally difficult. As Bellway and all the UK builders were falling to support it took strength to become a buyer. The crowd were stampeding in the wrong direction.
- I fade the short term trend in the direction of the long term trend. The long term trend in Bellway and the sector has been upwards for years.
- I place my entries where the masses place their stops. In the setup detailed above the entry is just after most have been stopped at the lows. MR Gann didn’t wait for any confirmation and simply bought as the market reversed through the previous low. I think getting onboard after the low has been confirmed by an end of day close is just fine for our purposes.
The week ended on a positive note with both the Primary Wave and the underlying trend on the UK VectorVest Composite moving upwards. There is a green light in the price column of the Color Guard. For the last three sessions there has been a green light in the Buy/Sell column of the Color Guard which shows that the move upwards is occurring on strengthening market breadth. That’s an excellent development for the bulls.
The MTI indicator which defines the underlying trend just missed going negative at the end of last week but has turned upwards on a level of 1.15. The DEW should give a Buy signal early in next week if the move continues. If and when this occurs I will be adding to my share portfolio.
Try VectorVest for 5 weeks (UK & UK data) – start now
David Paul
May 28th 2016
[Register now for David Paul’s Smart Trader Workshop Tuesday, 31st May 7.30 BST – Click here]
Be the first to comment on "A Setup for short term swing trading"