
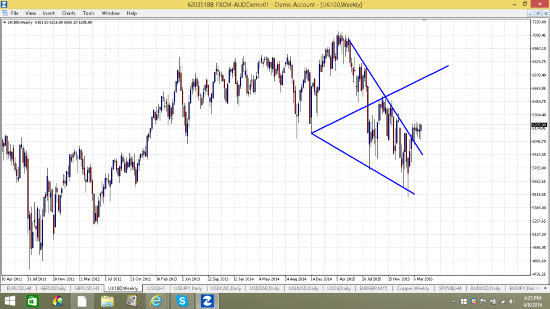
Above I show a weekly chart of the FT100 stock index. The pattern which I have roughly drawn with the blue trend lines is a “falling wedge” and it’s a bullish pattern which has very defined entries and exits.
The blue lines (defining the tops and the bottoms of the pattern) are coming together and should meet at some point in the future. The pattern is composed of 5 waves which charts 3 drives to a bottom.
For the brave, the place to buy was where the price touched the lower blue trendline which defined the lows of February to the tick. This level in both time and price was defined in advance by drawing a simple line with an old fashioned ruler. I am more than happy to admit that’s its always very easy in hindsight.
At that time the VectorVest MTI indicator was signaling that the market was much oversold with a reading of less than o.6. There is no need to be a war hero at the low. It’s OK to wait for a little confirmation although my mentor MR Gann instructed to get aboard at support. The Primary wave on VectorVest turning to UP after this point was an excellent but confirmed, low risk entry. This is where I started to build my first positions and have done my best to catalogue those in this forum.
I have used the falling wedge and its brother the rising wedge (a bearish pattern) for many years on all time frames down to a 5 minute chart of stocks, indices and Forex. In that time I have noted that an up sloping trendline, drawn as I have shown above, provides an excellent target. For the Elliott analysts reading, this is a line between wave 1 and wave 4 of the formation. If this occurs on this occasion then it means that the Ft100 is heading much higher to around 6670. This would be most welcome. I will spend some time on the targets from both rising and falling wedges in the webcast that I take next Monday afternoon at 130 UK time.
The wedge pattern traded bravely has a very high hit rate with an enormous risk to reward ratio and its right up there with the Gartley 222 in my list of “desert island” trading tools.
The FT100 and the VectorVest Composite UK has been in a range for the last week. If the Ft100 breaks the range then I feel there is a high probability of a strong and fast move to 6800.
Note I said probability. I am holding my positions as long as the VectorVest DEW market timing system stays “long” and positive. If the market breaks and I observe green lights on the VectorVest “Color Guard” then I will add to those positions but wary that the MTI is becoming overbought.
If these terms of “Green Lights” and DEW sound like Outer Mongolian to you, then please come along to one of my live events in London or a webcast. Details of the live events are at www.vectorvest.co.uk or just call support at 0800 014 8974 in the UK or 0800 981 891 in SA.
David Paul
April 8th 2016
Trial VectorVest click here
Be the first to comment on "A positive chart pattern on a weekly chart of the FT100."